Data Visualization: Women in Athletics
A semester-long project focused on researching and visualizing data for a topic of my choice: Women in Athletics. I conducted research on multiple aspects of women in athletics and compiled a series of three data illustrations to capture and convey the content in a succinct and visually compelling composition.


Process Mapping
The first visualization is focused on an evolution within the topic. I conveyed the progress these individuals and events have made in the realm of women in athletics. The qualitative data of the hallmark women and events juxtaposed with the quantitative data of the bar graph depicting the salary gap captures a glimpse of the past and present situation that female athletes face.

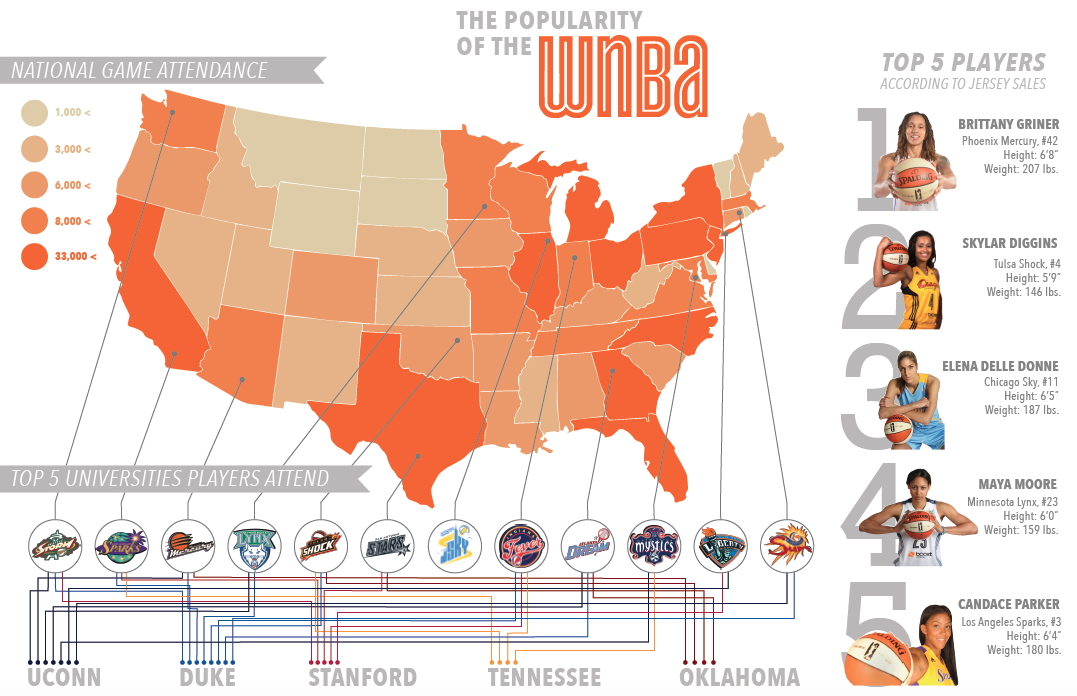
Geographic Map: Popularity Of The WNBA
The second visualization showcases a geographic element overlaid with secondary information. I chose the national popularity and game attendance for the WNBA as well as the most influential colleges contributing players to the professional league. I also highlighted the five most outstanding athletes of the WNBA at the time to provide photographic reference and an additional layer of information.

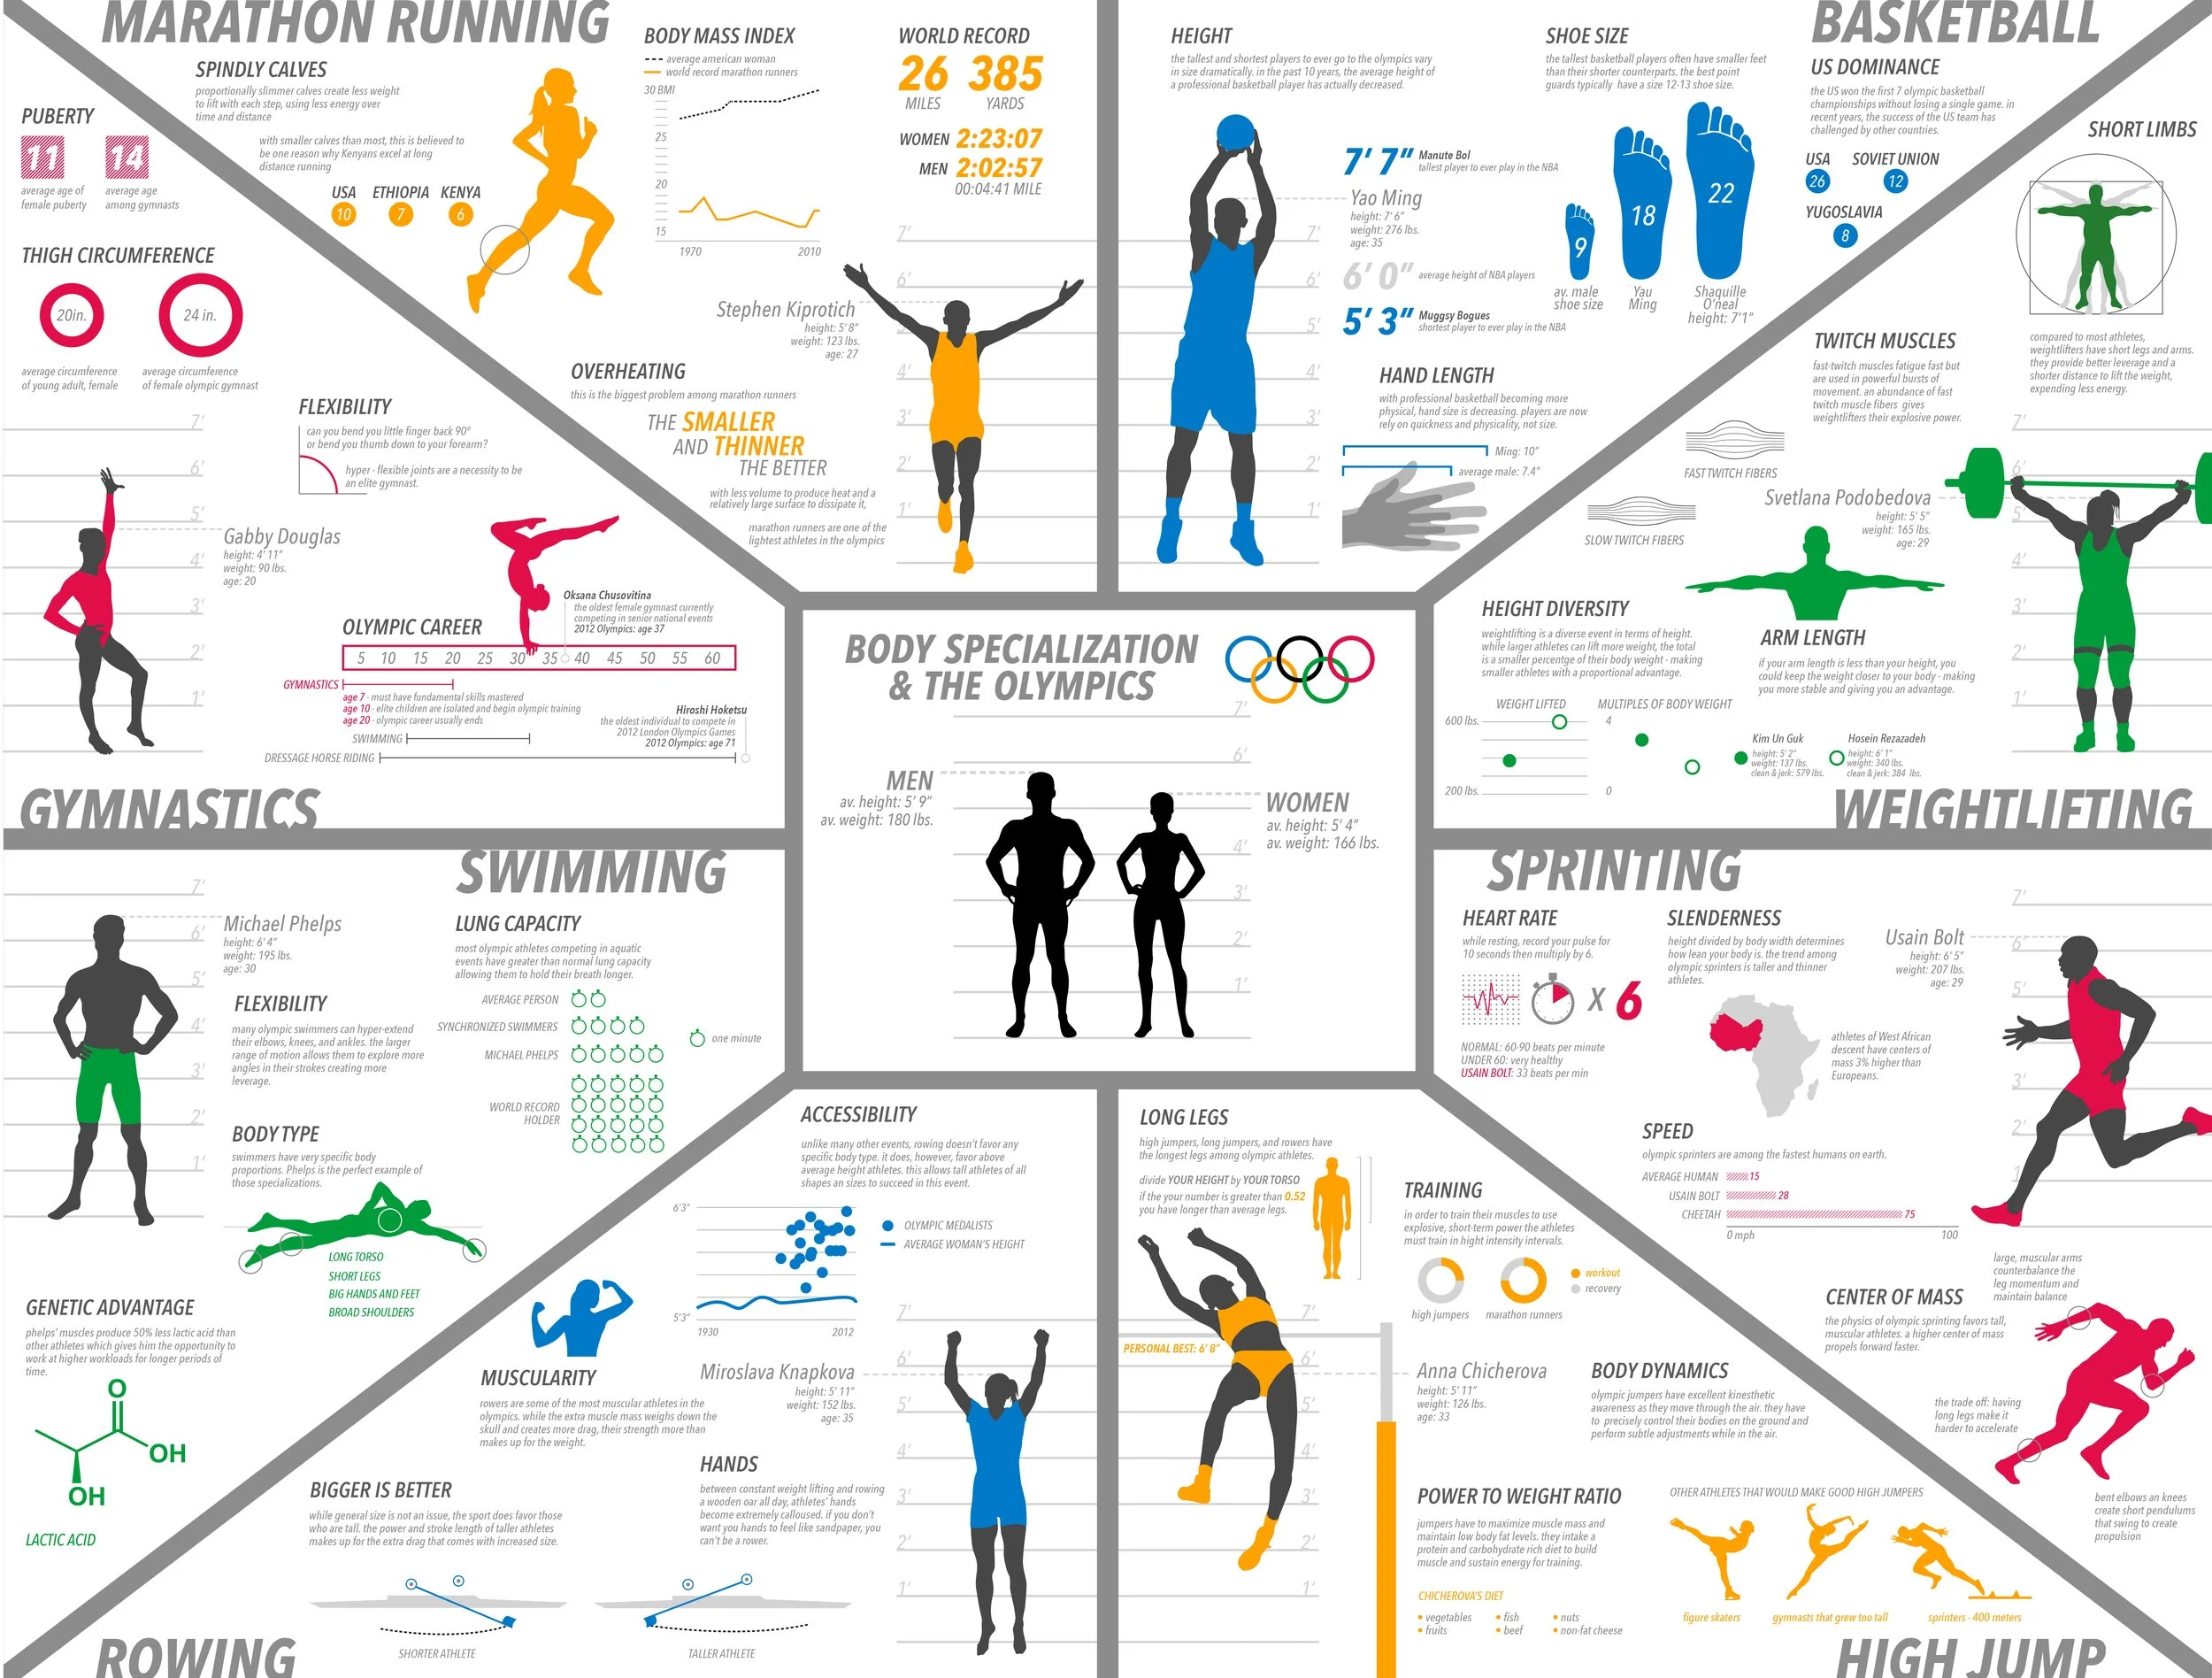
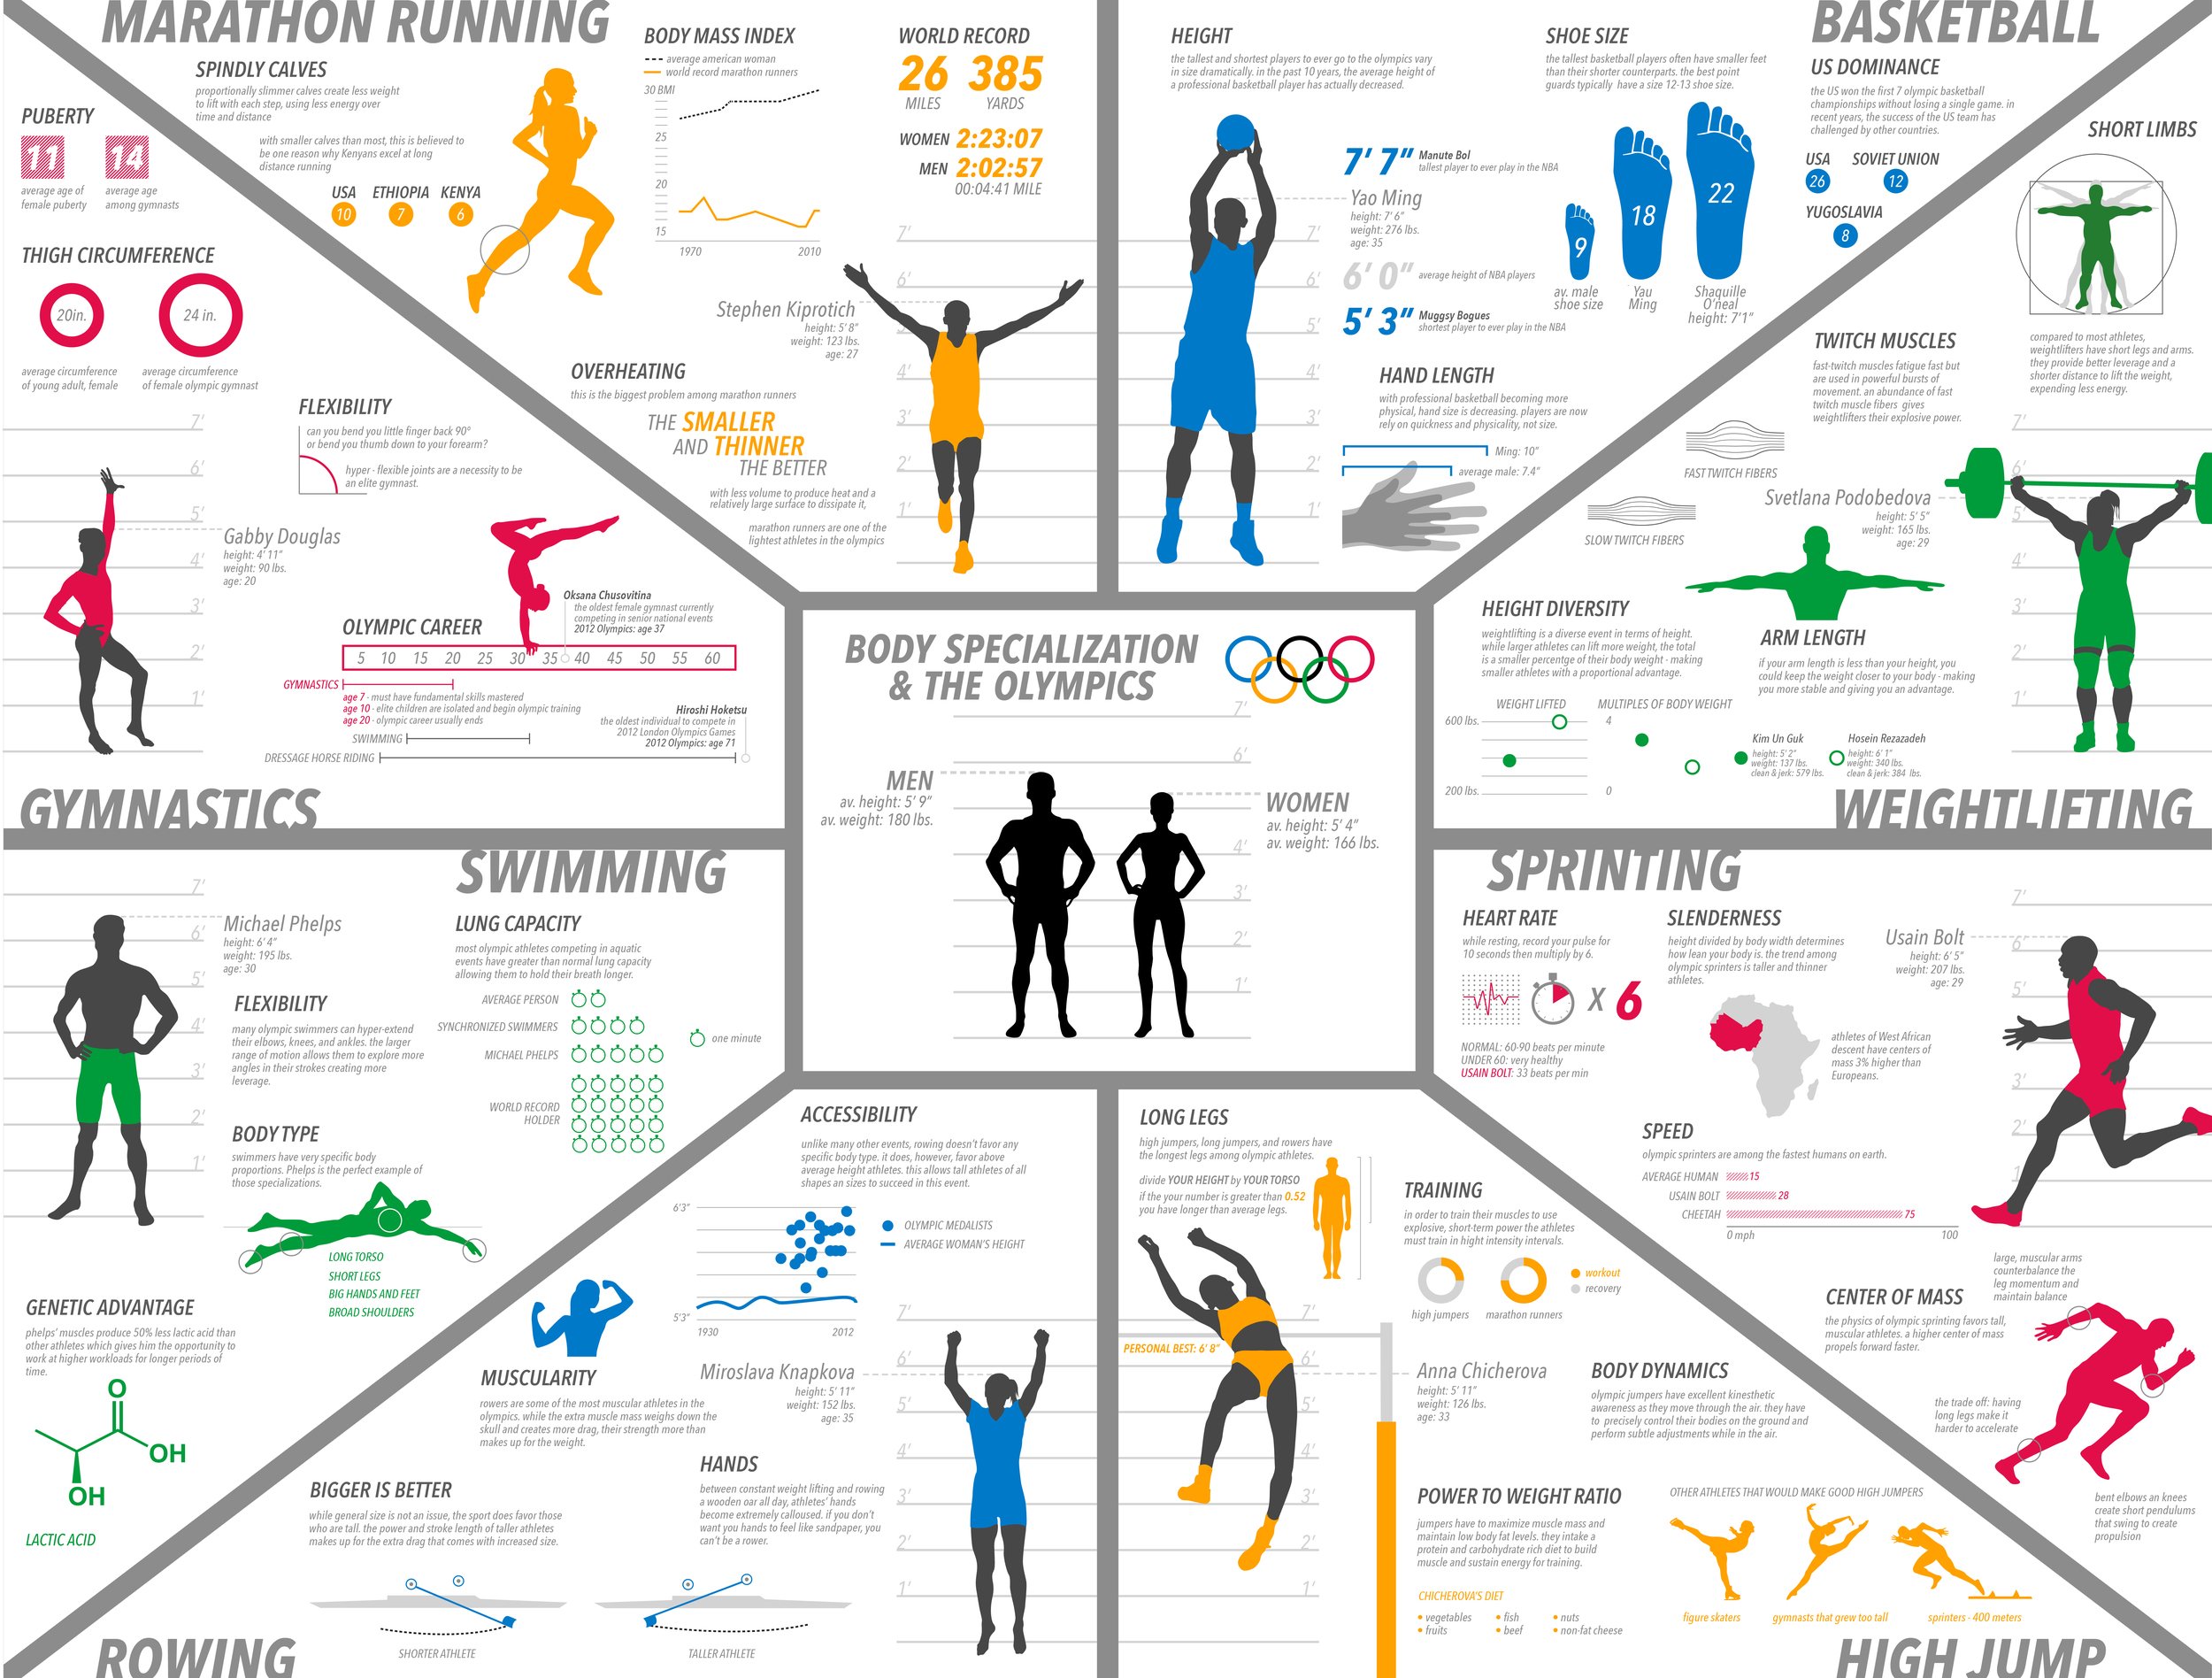
Body Specialization and the Olympics
The third visualization illustrates data on body specialization and its effect on success in professional athletics. This graphic highlights relevant and distinguishing aspects of each individual and their specific event - showing the viewer the differences of these extreme individuals at a glance.
Process Mapping
Process maps created for Walt Disney Imagineering illustrating various data points and how they inform and interact with the overall process.

